
No one likes to talk about dying. Sudden death due to heart disease occurs 250,000 times a year in the United States. A person is just living their life and unexpectedly their heart stops. Just like that…you’re officially clinically dead.
Not so fast. If this happens when you’re not alone, you’ve got a fighting chance. If your companion recognizes a life and death emergency is happening, acts fast to call 911 for help, and starts chest compressions, you could be resuscitated. You could cheat death.
Did I mention the city you live in is also a factor? What? Why would where you live matter? Turns out there is as much as a five-fold difference in survival rates depending on what community you live in? (1) What? Each community has access to the same research knowledge, have the same medical equipment and drugs, have first responders and paramedics, but have a wide variation in patient outcomes. That doesn’t sound, right? How can we learn from the best?
Back in the 1990s, EMS systems expert Jack Stout wrote an article in the Journal of Emergency Medical Services advocating for the practice of benchmarking. (2) He made the case that benchmarking offered two opportunities: 1) it helped you see where your results compared with peers and 2) it helped to identify exemplars who we can go learn from. Stout described these as lateral benchmarking and best practice benchmarking.
Lateral Benchmarking
Stout opens his article by describing a leader who is presented with data from different areas of performance in his or her organization but with no context to know if these data points were good or not. One way to better understand your outcomes is to compare with other like systems. This is known as lateral benchmarking.
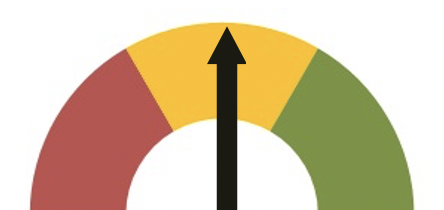
Stout described how a leader‘s understanding of their performance is incomplete in isolation (figure 1). It has no context to know how you are doing compared to similar organizations. Over the series of figures to follow, imagine your organization is the blue “H” logo.

Figure 1. You and your data
You are curious where you compare to peer organizations and join an industry-leading benchmark service that promises to compare your organization’s performance to similar organizations across a set of common measures.
Healthcare organizations participate in many third-party benchmark services comparing quality, safety, and patient experience measures. Vendors compile like data across similar health systems and produce regular reports showing where you compare to the other participants. Data reporting is often static or compares this quarter with last quarter or last year. It’s a snapshot and does not provide learning about variation or performance over time.
You receive your first quarterly benchmark report and it shows your performance is in the 50th percentile (figure 2).
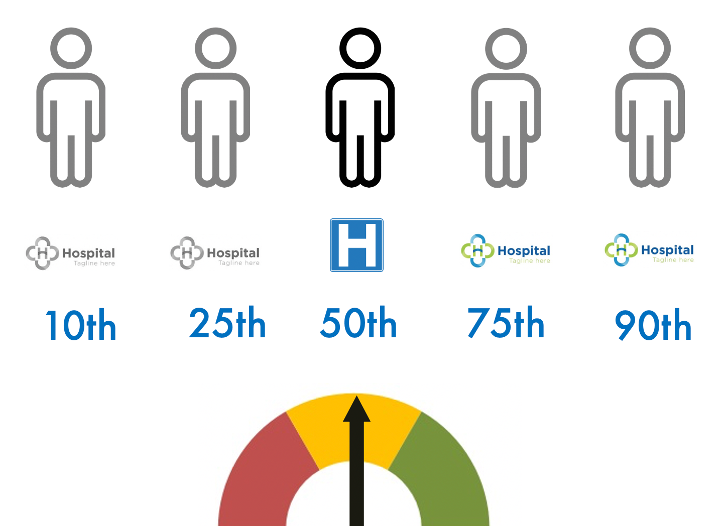
Figure 2. First Benchmark Report
Reviewing the report with your team, you see your current performance is in the middle. Half of the systems in the sample have better performance and half are not as good. A team member notes the report only shows how you compare to others but doesn’t provide insight into your own performance or the performance of the other systems. The team discusses your aspirations, you agree you want to be in the 90th percentile, and then you go back to your regular work.
Everyone continues to work hard and deliver your best efforts. The idea of improving to the 90th percentile comes up at leadership meetings. Before you know it another quarter has passed and the latest benchmark report arrives (figure 3).
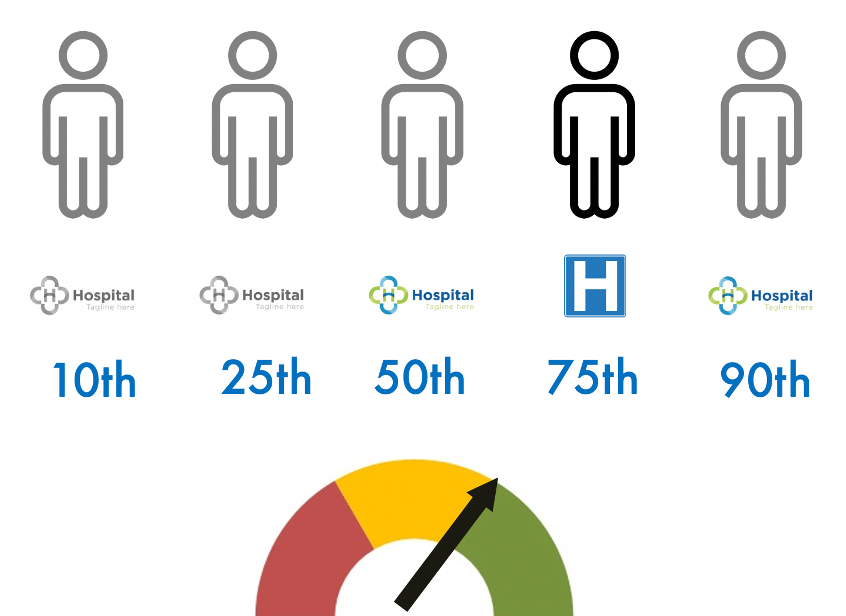
Figure 3. Second Quarterly Benchmark Report – 75th Percentile!
As the team reviews the new report, you are excited to discover you have moved to the 75th Percentile. There are smiles all around. Small conversations spark up affirming how great your people are and leaders share anecdotal stories of examples of great service. The marketing lead quickly drafts an announcement to staff and a press release to alert the local media. Everyone is thrilled. The team agrees again with your desire to be in the 90th percentile. Everybody cares about their patients and wants to do great work. You all knew you were doing quality work but didn’t know how good you were. Seeing improvement in the benchmark report felt validating. You all return to their regular work.
Everyone is excited about the next upcoming quarterly benchmark report. You are hopeful it shows continued improvement and reflects your hard work and best efforts. The report arrives and the team meets to review the results (figure 4).
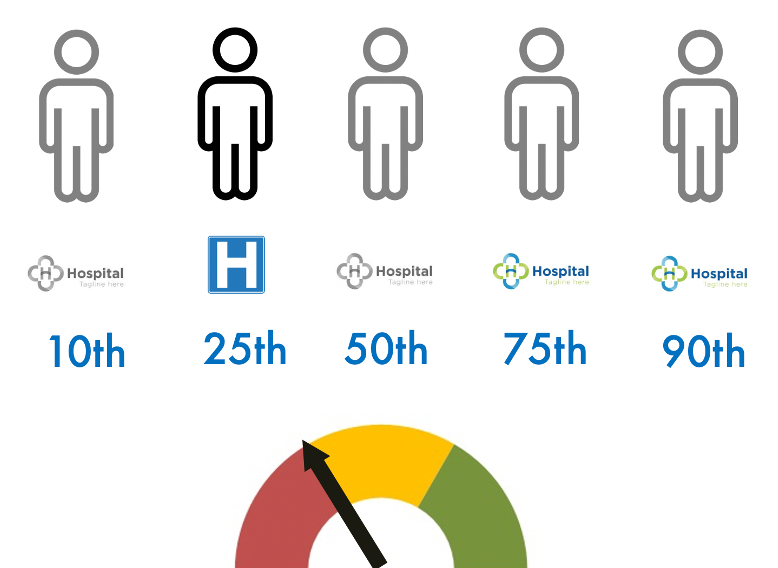
Figure 4. Third Quarterly Benchmark Report – 25th Percentile!
What happened!? The meeting room is very subdued. You can tell from the body language in the room everyone is deflated. A physician leader proposes a plan to investigate ‘what went wrong’ and hold the people accountable. The media lead is preparing draft talking points in anticipation of the media questions. Thankfully, the chief quality officer interjects and says, “folks, dropping to the 25th percentile doesn’t feel good, but we haven’t changed anything in our system.” Everyone stops and looks at each other. If we didn’t implement any changes, what happened to our results?
At this moment, the leadership team had a major “aha moment” about lateral benchmarking and the limitations of ranking. Percentile ranking does show you where you stand in line in relationship to those benchmarked but it offers little insight into the performance of the peer systems or your own. You know to get a different result, you have to change something in the system and your internal key performance measures are unchanged. What happened? Figure 5 replaces the percentile ranking with generic run charts reflecting the performance of each system.
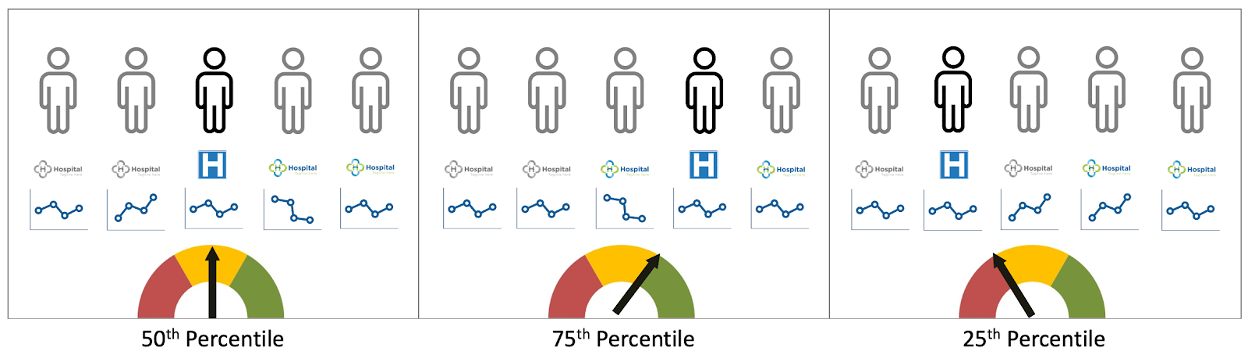
Figure 5. Three Quarters with Generic Run Charts
In each quarter, your hospital sustained your results. Your run chart shows the same performance each quarter.
In the second quarter, one of the benchmark system’s performance declined and this changed their position in the ranking and increased your ranking.
In the third quarter, two benchmark systems did improvement to their systems resulting in enhanced performance. This moved them up in line–in ranking–which reduced the ranking of your system even though your performance remained the same.
As Stout notes, having a “…frame of reference to tell how you are doing compared to [others]..” helps leaders know how you stack up. It helps you have a sense of what good looks like and how you compare. It doesn’t however tell you what’s happening in your organization or whether your efforts are resulting in improvement.
Stout goes on to describe another benefit to benchmarking…identifying best in class. “…To learn how this superior performance is created, so [you] can consider incorporating those methods within [your] own operations…to objectively identify, validate, and accelerate the spread of ‘best practices.’”
Best Practice Benchmarking
Langley et al describe best practice benchmarking as “…looking around at how others are doing things to learn new approaches and possibilities. A formal benchmarking process furnishes a method with some structure for making these observations and then using this information for improvement.”’(3)
Knowing where you rank in the benchmark sample of systems helps provide the context Stout described and aids you to see what’s possible. You want to look at the best practice system (figure 6) so you can learn from them.
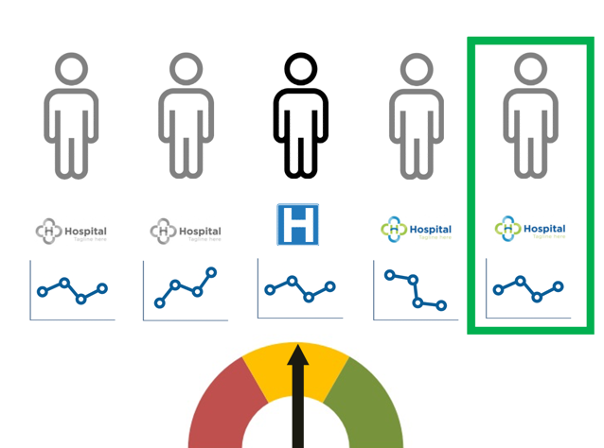
Figure 6. Best Practice to Benchmark
Did you know for decades Seattle, WA was the best community on the planet to have your heart stop? If you were walking down the street and suffered a sudden cardiac arrest, you had the best potential that the key drivers of bystander CPR, rapid EMS system response, and high-quality resuscitation occurred reliably and gave you the best chance of survival. For decades, communities were aware of Seattle’s published outcomes and knew they were significantly higher than the national average. Many questioned the results and few visited to learn about their work.
More recently, communities began comparing their outcomes, focused on the care process to reduce variation, and went to Seattle to learn from the caregivers and researchers. Seattle remains one of the best places to have your heart stop. What’s changed is so is Minneapolis, Charlotte, and a growing number of cities that have all dramatically improved their community efforts and care processes built on the shoulders of Seattle.
Closing Thoughts
Lateral Benchmarking is useful for putting your organization’s performance in context. You can’t stop there. Looking to best practice organization helps you see what’s possible and offers an opportunity to learn from organizations that are performing at exemplar levels. Then it’s time to pivot your attention inward to your own improvement work.
—
If this was helpful, share and include me @DaveWilliamsATX. Subscribe to receive a monthly curated email from me that includes my blog posts and Improvement Science resources I think you’d appreciate.
References
(1) Eisenberg, M.S. Resuscitate! How your community can improve survival from sudden cardiac arrest. Seattle: University of Washington Press, 2009.
(2) Stout, JL. Capture the competitive edge: How benchmarking can improve your ambulance service. Journal of Emergency Medical Services 21, no. 9 (1997, September): 51, 53-56.
(3) Langley, Gerald J., Moen, Ronald D., Nolan, Kevin, M. Nolan, Thomas W., Norman, Clifford L., and Provost, Lloyd P. The improvement guide: A practical approach to enhancing organizational performance (2nd Edition).San Francisco: Jossey-Bass. 2009