
Making changes to a process is essential to improvement. Improvement efforts require chartering projects that will impact strategic processes requiring design or redesign. Organizations routinely struggle with selecting processes needing improvement and that will achieve the organization’s objectives. What follows is a structured process, using qualitative methods, to support selecting processes with the greatest impact.
Bennett and Provost (2015) describe the use of a driver diagram as a visual display of an organization’s theory for what must change and how it must change to achieve your desired outcomes. A driver diagram is commonly used in healthcare and education to develop a portfolio of projects or to outline a theory for how to achieve the aim. Not all change required to achieve the outcome is of equal weight but improvers often do not have a method for zeroing in on the vital few.
Improvement advisor Richard Scoville, Ph.D. provides a useful method. Here is a driver diagram from an improvement effort focused on improving oral health.
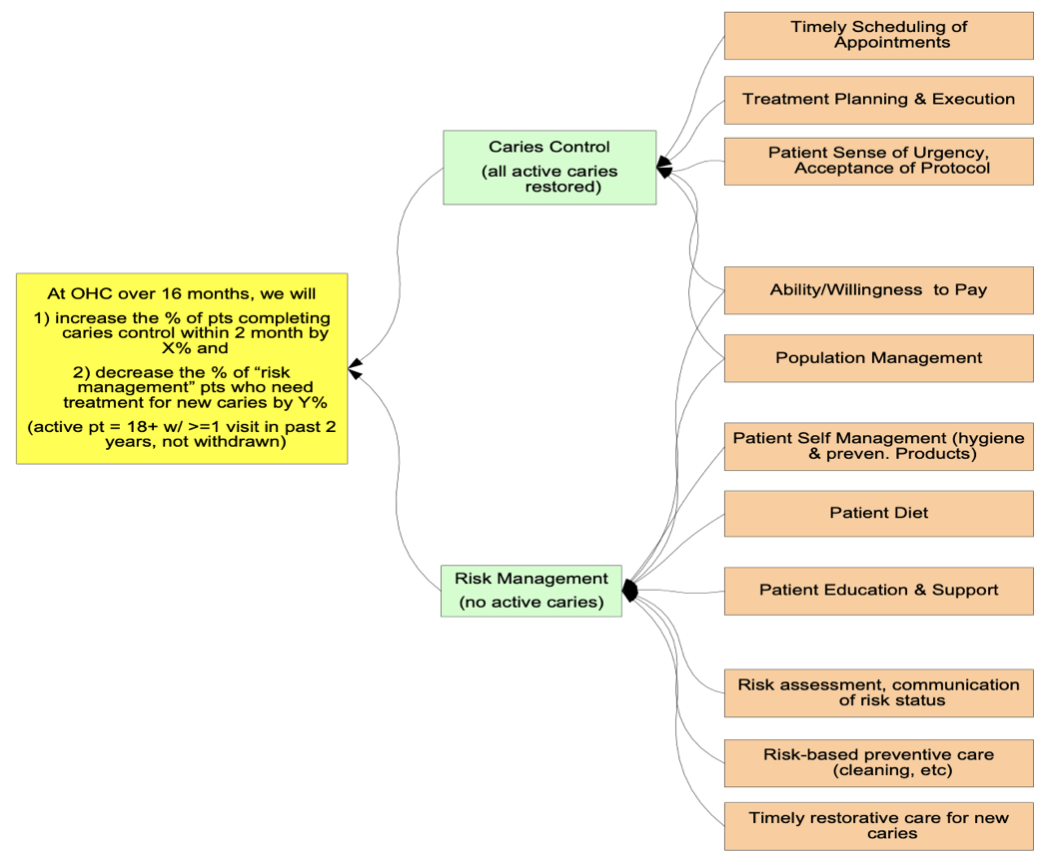 Figure 1. Driver Diagram for Improving Oral Health (Source: Richard Scoville)
All of these changes may be required to achieve the desired aim. The secondary drivers are not equal in their potential impact or current process condition. How can an improvement team use a structured approach to decide where to start?
Dr. Scoville presents an approach adapted from a method outlined by Associates in Process Improvement (Quality as a Business Strategy, 2009). Each secondary driver is assessed using two qualitative criteria: the predicted impact on the aim and the current status of the driver. Below is Scoville’s adapted criteria.
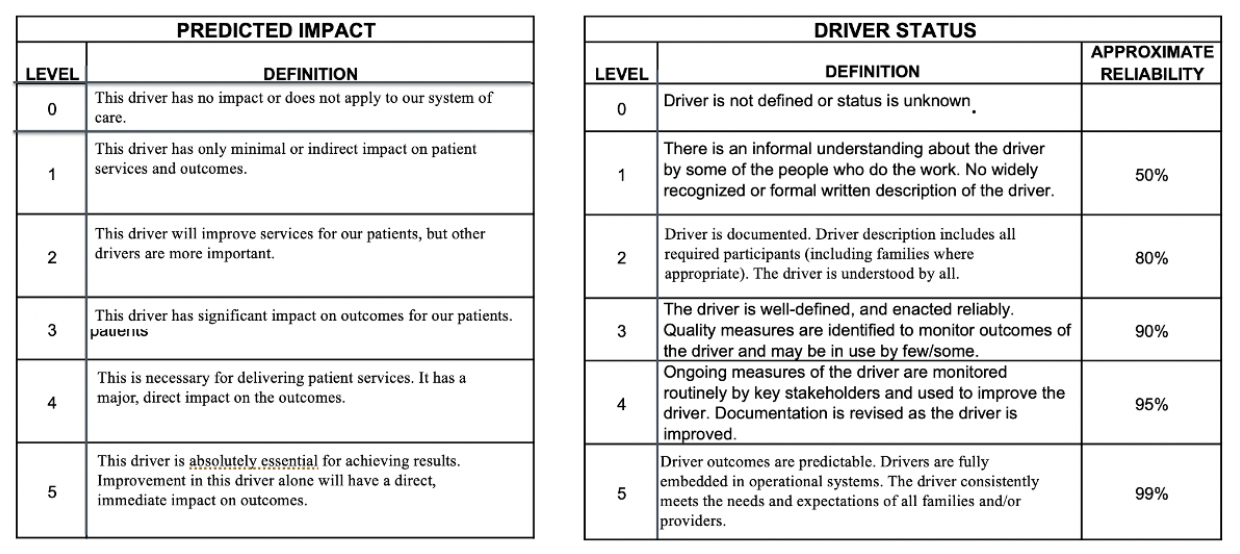
Figure 2. Two Criteria to Assess Secondary Drivers
After the team reaches a consensus on the assessment of each driver against the two criteria, a scatter diagram is used to display the data. The X-axis – along the bottom – reflects the rating against the criteria of the predicted impact the driver will have on the aim. The vertical y-axis reflects the rating of the current status of the driver. The name of each secondary driver is positioned at the intersection of those two values on the diagram.
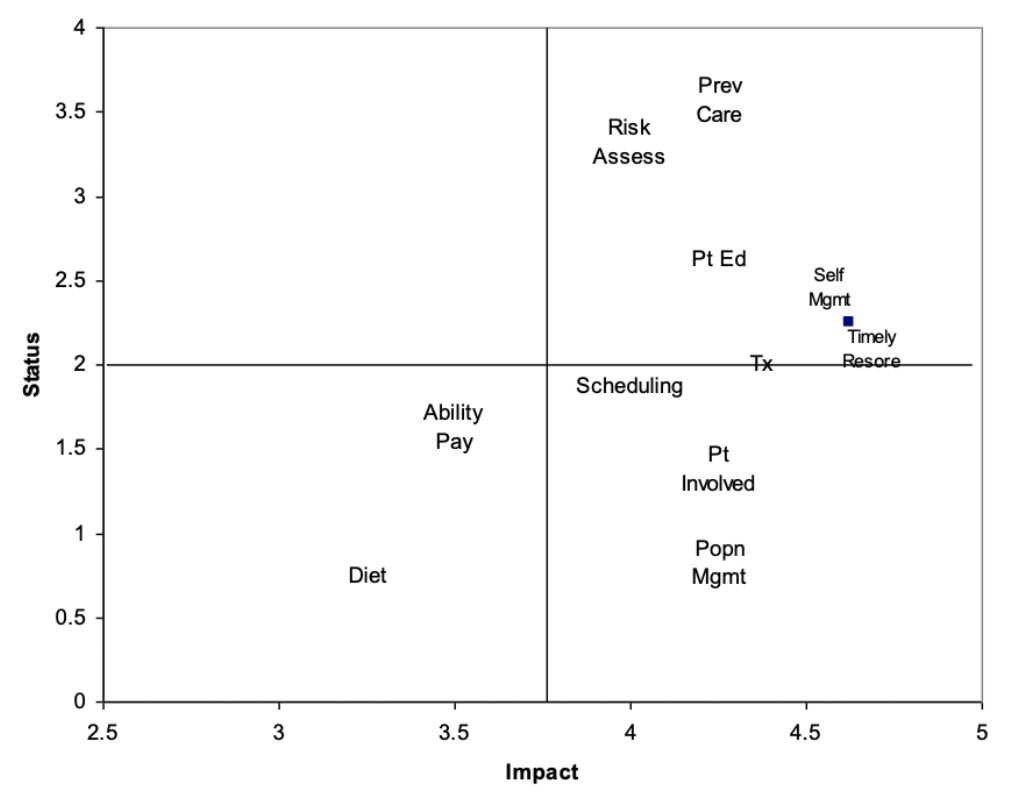
Figure 3. Scatter Diagram of the Secondary Drivers.
Each quadrant of the scatter diagram is a different relationship between the two criteria. Using the Pareto Principle, improvers wish to select the drivers with the highest predicted impact on the aim. The quadrants on the right side are all rated higher for their predicted impact.
The second criteria is driver status. Drivers with less well-defined process reliability are opportunities for improvement. Creating a new process where one does not exist or improving the reliability of an existing process that is not reliable is ideal for affecting the aim. Secondary drivers predicted to have a high-impact on the aim but are currently rated low in status are the best place to begin.
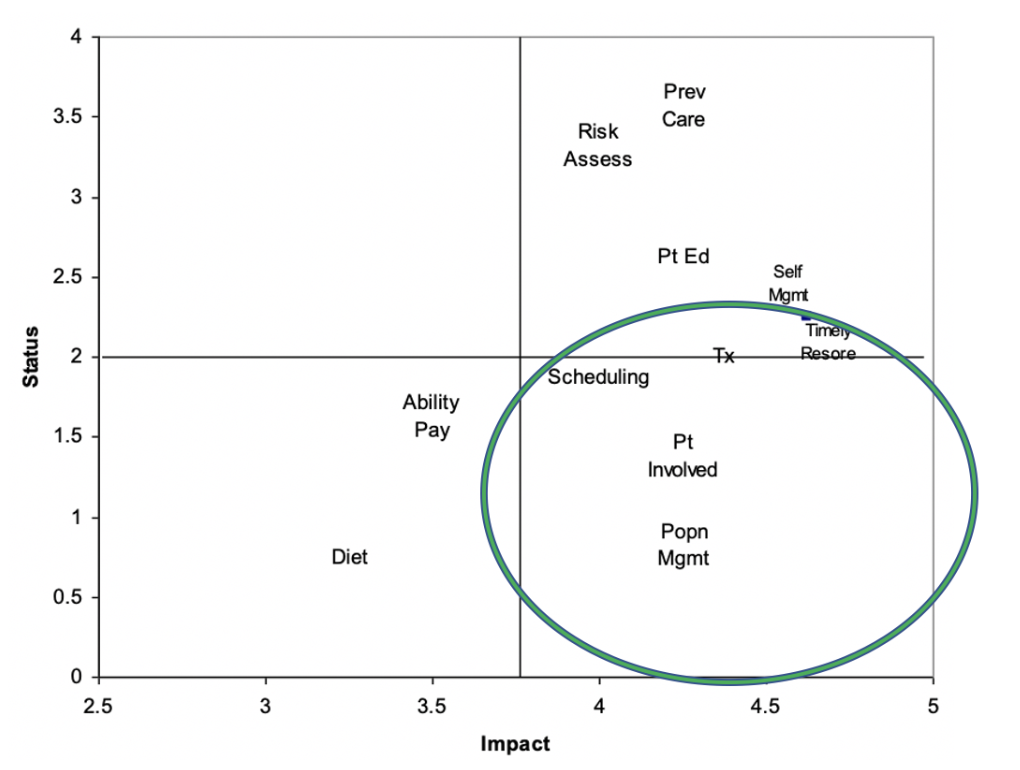
Figure 4. Drivers with High Predicted Impact and Low Driver Status
The bottom right corner holds the secondary drivers offering the best opportunity for improvement based on the improvers’ assessment. Beginning tests of change in these drivers may result in improvement that affects the aim of interest.
This simple method provides a systematic approach to guide improvers to zero in on the vital few drivers to focus their improvement work and be more efficient at testing changes that will result in improvement. Try this on your own driver diagram and share what you learn.
—
If this was helpful, share and include me @DaveWilliamsATX. Subscribe to receive a monthly curated email from me that includes my blog posts and Improvement Science resources I think you’d appreciate.
References
Associates in Process Improvement, Quality as a business strategy, Austin, TX: API-Austin, 2007
Adapted from a presentation prepared by Richard Scoville, Ph.D., Improvement Advisor.