
The Breakthrough Series Collaborative model is an improvement learning system that brings teams together to pursue a shared aim. Teams use an evidence-based change theory and improvement methods including the Plan, Do, Study, Act (PDSA) Cycle and time-series data (run charts and Shewhart Control Charts). In the Institute for Healthcare Improvement’s White Paper (1) on the model, there is an early sketch of the prototype learning system.
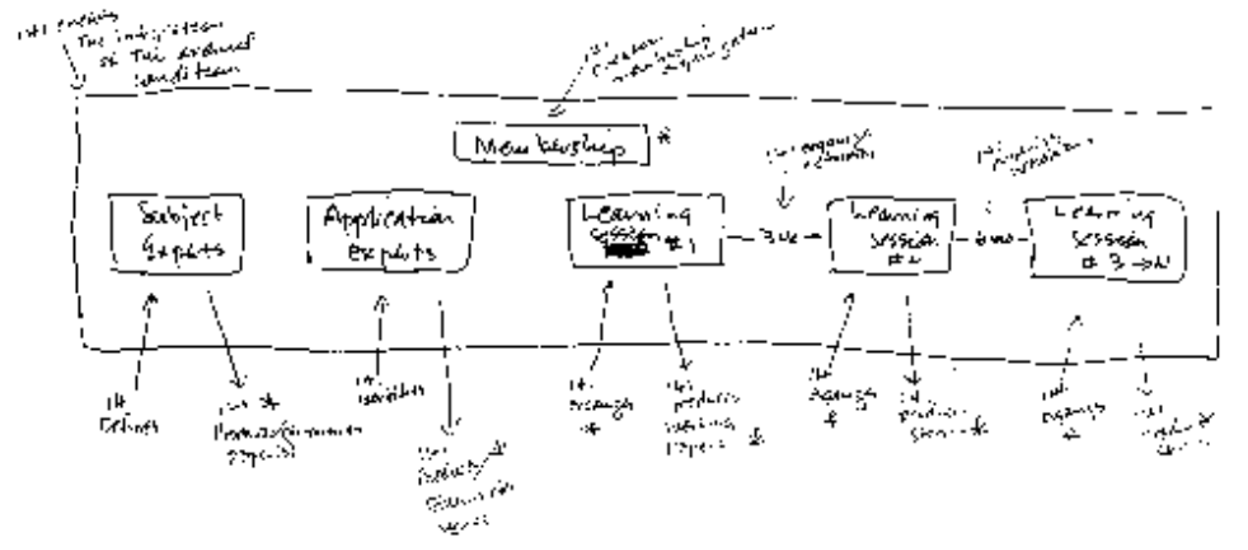
Figure 1. Sketch of the Breakthrough Series Model by Paul Batalden, MD (1994)
Dr. Don Berwick tells the story that he and Dr. Paul Batalden were sitting together at a meeting in Dearborn, MI discussing “…the stubborn problem of moving from conversation and study, or education for improvement to action, or engaging informative changes in real care processes “on the ground.” (2) Batalden began to sketch on the back of a paper placemat and slid this now-famous sketch to Berwick. A problem, a sketch of a change idea, and the blueprint for improvement.
Dan Roam, the author of The Back of the Napkin, (3) tells a similar story of being on a British Rail train crossing through the British Midlands en route to fill in for a colleague to deliver a talk for which he had no prepared presentation. As he and a colleague brainstormed ideas, he grabbed a stack of napkins and began to sketch out a visual of his theory for the talk. The result was a clear depiction of the core components of the talk and how they connect. Instead of using his sketch to aid him in building a traditional slide presentation, Roam recreated the visual on a slide and used it as the basis for his talk. This experience with the power of visual problem solving inspired him to learn more and write a great book.
When I’m advising people, I frequently take out a piece of scrap paper. Usually, it’s a meeting room notepad within reach or the back of a handout. As someone tells me about their work and the problem they are trying to solve, I capture notes and key ideas. I draw visual depictions of what I’m talking about as I explain ideas or concepts or help them breakdown how they might think about their work. I’m surprised how often I’m asked if they may keep my sketch to remember the conversation.
This past year, I had the pleasure of leading an Improvement Advisor (IA) Professional Development Program in Cardiff, Wales with Improvement Cymru, the improvement specialists of Public Health Wales. The IA program follows a similar structure to the Breakthrough Series. Twenty improvement learners bring a strategic improvement project to apply improvement science and methods to over the year. We spend three intense in-person workshop weeks together bridged by two to three months where the participants work on applying improvement methods to their projects back home.
On the last day of the workshop week, I shared my vision for the action period with the group. To help them, I drew a sketch (figure 2) to visualize what their execution could look like. Here is how I explained it do them.
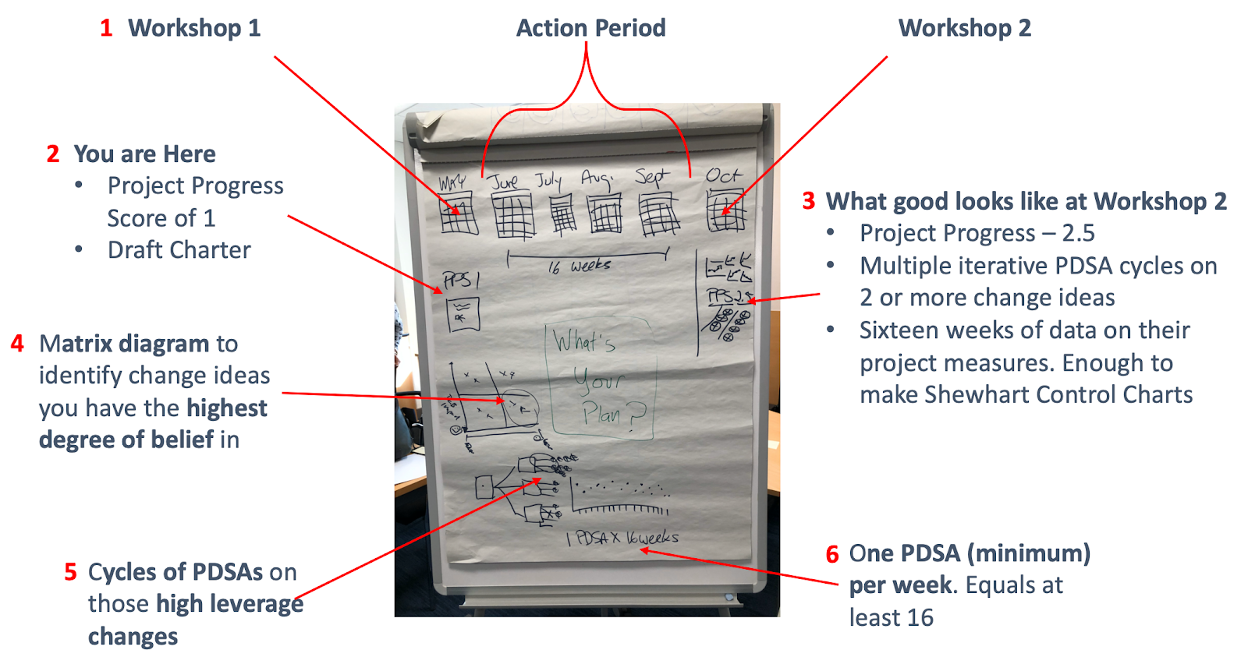
Figure 2. Action Period Project Plan Sketch on a flipchart
-
- We are on the last day of workshop 1. There is a sixteen week action period until workshop 2 when we meet again.
- You are here in your project. You have a well-crafted draft charter using the Model for Improvement (Aims, measures, changes). Your current IHI Project Progress Score (4) is 1 to 1.5: Team formed, the population identified, an aim set, measurement begun, your team met, planning has begun.
- What good looks like for workshop 2 is an IHI Project Progress Score of 2.5 (changes tested, but no improvement), several iterative ramps of PDSA tests across more than one change idea, and sixteen weeks of data collection for each of the project measures (outcome, process, balancing).
- Use a matrix diagram to assess your change theory and identify the change ideas you have the greatest degree of belief will result in improvement. Start your PDSA testing there.
- You will execute several documented iterative ramps of PDSA tests across more than one change idea.
- Complete a minimum of one PDSA test per week or sixteen across the action period. I pushed for more.
Using this diagram, a lot of information is conveyed visually as a system. The learners see the aspiration for when we come together again and get a practical and tactical sense of what executing to meet that expectation looks like.
I used a similar visual display while working with a group of improvement advisors in Scotland. The Children and Young People’s Collaborative (CYPIC) is a national improvement effort to improve the educational attainment of school-age children. The work had ambitious national aims and project teams started with small scale pilot projects in single communities. Part of the work was thinking through how these pilot projects achieved scale.
Dr. John Whittington, one of the leaders behind the development of the Triple Aim for Populations, shared a critical reflection with me for working with populations. To achieve an aim at scale, you have to know what full scale looks like and build your execution strategy accordingly. Many projects start small with no idea what full scale looks like. What if the improvements can’t work at full scale? What if you are doing iterative PDSA tests on one child at a time and you have to scale to thousands of children by the end of the year? This was the reality for the Scottish improvement work.
We approached this as Fermi Problem and blended visual problem solving with estimated calculations. Enrico Fermi is credited with the concept of “back-of-the-envelope calculations” where gross estimations are used to get a sense of reasonable prediction. Figure 3 shows an attempt to apply Fermi’s theory to our real problem.
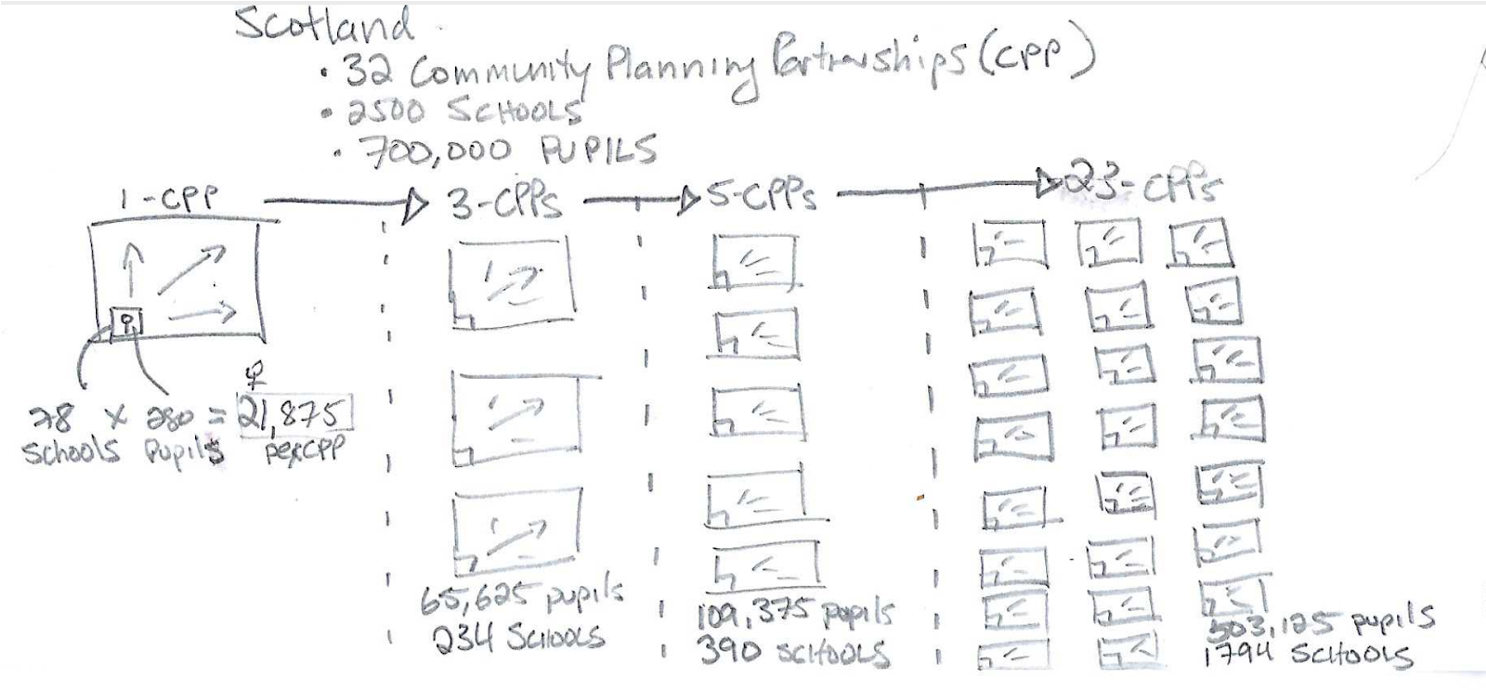
Figure 3. Fermi Back-of-the-Envelope Estimation of scaling improvement work to all schools and pupils across Scotland.
In Scotland, the work needed to scale to approximately 700,000 pupils, across 2500 schools, located in 32 Community Planning Partnerships (CPP) in three years’ time. Imagine current PDSA testing is occurring in a single school. If we divide the total number of pupils and the number of schools in Scotland by 32 CPPs, we estimate each CPP has an average of 21,875 pupils and 78 schools or 280 pupils per school. Our theory was to initially achieve scale in one CPP and then spread across the country by going from one CPP, to three CPPs, to five CPPs, to All (full scale).
Our initial scaleable unit is a school of 280 pupils. To reach full scale within our initial CPP, the work would need to be spread to 78 schools reaching 21,875 pupils. If we can achieve results in one CPP we can start to think about replicating in three CPPs with each CPP having the same assumptions. Three CPPs jumps to more than 65,000 pupils across 234 schools.
Quickly these rough calculations open your eyes to the logistics of taking this work to scale. It also becomes very apparent small scale testing in one school for an extended period of time is not going to reach full scale in three years. We need to adapt our execution strategy to achieve the aim at scale. Using a back-of-the-envelope calculation quickly helps us appreciate the scope of our work and visualize the size of the population. Now we can build an execution strategy better suited for getting to full scale.
Closing Thoughts…
Pulling out a piece of scrap paper and sketching out ideas visually is a rich tool for understanding your work, explaining ideas, and problem-solving. Adding rough estimate data can further support generating a helpful perspective. All you need is a pencil and paper and you have a powerful method for learning in support of improvement.
—
If this was helpful, share and include me @DaveWilliamsATX. Subscribe to receive a monthly curated email from me that includes my blog posts and Improvement Science resources I think you’d appreciate.
References
(1) Institute for Healthcare Improvement, The Breakthrough Series: IHI’s Collaborative Model for Achieving Breakthrough Improvement, Cambridge, MA: IHI, 2003.
(2) Berwick, Donald M. “The Origin and Evolution of the Breakthrough Series Collaborative.” in All In: Using Healthcare Collaboratives to Save Lives and Improve Care, edited by Bruce W. Spurlock and Patricia A. Teske, 30-44, Roseville, CA: Cynosure Health, 2015
(3) Dan Roam, The Back of the Napkin: Solving Problems and Selling Ideas with Pictures. London: Penguin Group, 2008
(4) Institute for Healthcare Improvement. Assessment Scale for Collaboratives. Cambridge, MA: IHI, 2004