
This is part of a series of blog posts on measurement for improvement. You can read them all here.
When you create a run chart or a Shewhart chart with baseline data, you can “freeze” the centerline and extend it into the future. Shewhart charts that have equal subgroup size can have baseline limits extended. It’s not possible to predict and extend limits for charts with unequal subgroup size (c-chart, u-chart, XbarS) so just extend the baseline centerline.
A frequent question is: When is it okay to revise or rephase or recalculate? This is frequently confusing as we encounter many examples of chart displays where the chart centerline or limits have been revised incorrectly. Examples include when a chart is revised to show the beginning of an improvement project, when an intervention was implemented, or the start of a collaborative. In most cases, the process or system has not improved, but anytime you compare the median or mean of two different periods of data (before/after), your software is going to calculate centerlines that will likely look different.
As a general rule, you only revise a run chart’s baseline centerline when there is a signal of change. For example, we have a shift of six or more consecutive data points above the median. If these data continue to sustain for 10 to 12 points, we can establish a new centerline starting at the beginning of the shift.
When it comes to Shewhart charts there are four situations that warrant recalculating.
- When trial limits were based on fewer than 20 subgroups
- When the Shewhart chart had special cause and now you want to recalculate limits going forward – those limits should be based on common cause variation only
- When improvement work has resulted in special cause – the same minimum subgroup guidance applies for developing the new trial limits (example in Figure 1)
- When a Shewhart chart remains unstable over an extended period of time – 20 subgroups or more – and you’re not able to find and remove the cause – limits can be recalculated to see if the process is stable at a different level of performance
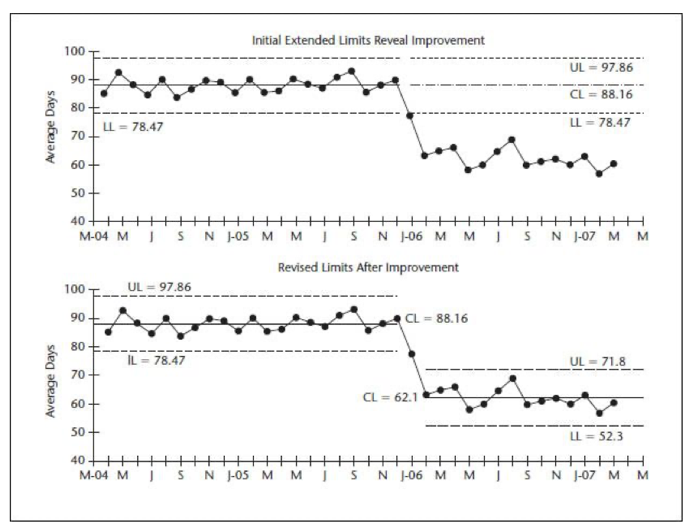
Figure 1. Shewhart Chart with Revised Limits and Centerline (HCDG, Fig. 4.16, p. 125)
These “rules” are guidance and require your subject matter expertise for application. It’s important to recognize that software doesn’t know the right answer and to rely on your direction to do the right thing. It’s possible for you to tell it to recalculate at any point, regardless of if there’s improvement or if there’s enough data, and give an impression of change. It’s your job to pick the right time and approach.
—
Want to learn about measurement for improvement? Check out my favorite book by Lloyd Provost and Sandy Murray called The Health Care Data Guide: Learning from Data for Improvement. Not in health care? Don’t worry. It’s still the best reference for improvement data and measurement out there.
—
If this was helpful, share and include me @DaveWilliamsATX. Sign up here to receive a monthly email from me that includes all my blog posts and other Improvement Science resources I think you’d appreciate.