
This is part of a series of blog posts on measurement for improvement. You can read them all here.
The primary purpose of measurement for accountability is confirmation if a measure meets or does not meet the established target. These measures are common in social systems. Examples include: Targets to see an emergency department patient in 4 hours or less; What proportion of high school students have a grade point average of 2.5 or greater? Does the call taker answer the phone in three rings or less?
Targets are frequently converted into measures that are looking at whether something happened or not. Did it meet the target or not? It doesn’t care about what’s happening in the process.
For example, in this run chart we see a team working on a project to reduce the waiting time for a colonoscopy. A target has been set to have the wait time less than 90 days.
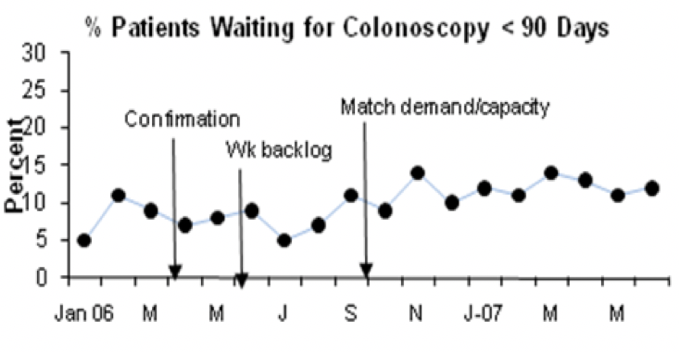
Figure 1. Data for Judgment (source HCDG)
Looking at the annotations in this chart, we see changes are being tested, but the percentage of patients getting a colonoscopy in less than 90 days is only around 10 percent. From this data display, you conclude this team is not meeting the target. Is that true? Note this chart is only telling us the proportion of patients who achieved the target. It provides little insight into the performance of the process and if it’s improving.
Now, let’s look at this project team’s data through a lens focused on improvement and on learning from the process. We want to look at data that helps us understand the performance and behavior of the process. Instead of looking at the proportion that received a colonoscopy within our target timeframe, what if we looked at the average actual time it takes to receive the procedure?
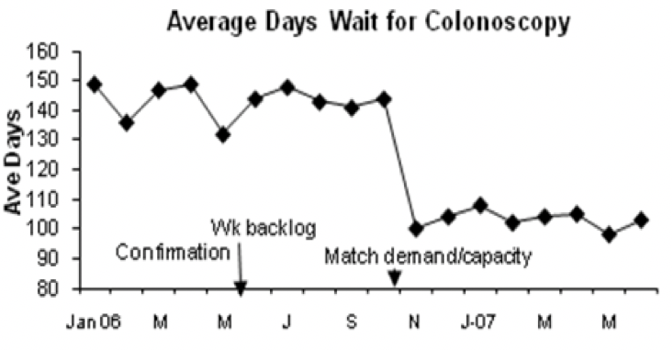
Figure 2. Date for Improvement (source HCDG)
By looking at the actual average wait time, we see a more helpful story. The run chart of average days shows the process was performing at 140 days at the start of the project and, as changes were tested, it has improved to an average of 105 days. Here, we see improvement is happening, and we are much closer to our aim.
As you consider developing measures, ask yourself how you can look at data that will help you learn the most. Tracking the actual measurement versus percent compliance supports learning versus judgment. Understanding the behavior of the data is the intent, not just if a target is met or not. Are there data you work with that you can transform from accountability to improvement?
—
Want to learn about measurement for improvement? Check out my favorite book by Lloyd Provost and Sandy Murray called The Health Care Data Guide: Learning from Data for Improvement. Not in health care? Don’t worry. It’s still the best reference on improvement data and measurement out there.
—
If this was helpful, share and include me @DaveWilliamsATX. Sign up here to receive a monthly email from me that includes all my blog posts and other Improvement Science resources I think you’d appreciate.