
In a recent blog post (here), I shared how Associates in Process Improvement transformed Dr. Deming’s theory of Organizations Viewed as a Production System into a five-part approach known as Quality as an Organizational Strategy.
In this series, we’ll take a deeper look at each of the five activities including Purpose, Mission, Vision, and Beliefs; Organization Viewed as a System (includes measurement); System for Obtaining Information; Planning; and Managing Improvement Efforts.
Activity 2 – Organization Viewed as a System
Ask most people to describe their organization, and they will present you with an organizational chart. An organizational chart shows the cascading connection of roles from the executive leader all the way down to the first layer of leaders. Included are the names and titles of those responsible. An organizational chart is a map of people and accountability, but it doesn’t offer much in the way of understanding the organization or how work gets done.
In Activity 1, we looked at the importance of being clear on what you are trying to accomplish as an organization and how you’ll approach meeting the needs of your customers. To meet that need, the organizational system must be designed and operated to do so. In many organizations, operations evolve, and structures, processes, and responsibilities are in place but not in a planned fashion. People may not be able to talk about how work gets done or how work is linked.
Organizational systems consist of all types of work accomplished for different reasons. Each activity could be described as a process, even if it isn’t currently standardized or documented. These processes serve various purposes, and many are linked and interdependent.
Processes may be considered in three broad groupings:
- Mainstay Processes – These are the core processes associated with service delivery. They are directly tied to the purpose of your organization and meeting the needs of your customers. This is the core business.
- Driver Processes – These processes help us plan for an organization to operate and improve. These include planning, innovation, regulatory requirements, changes in the science, and improvement efforts.
- Support Processes – These are processes that enable you to deliver the mainstay. These might include facilities, training, human resources, and accounting.
To better understand these processes, we can develop a conceptual model of the organization using a map. Begin by thinking of the key processes involved in delivering the mainstay and writing each down on a whiteboard or on a sticky note in the middle of a table. Now, do the same for your driver processes and put them on top. Follow with the support processes on the bottom. All first attempts are not right, so don’t worry about getting it perfect.
Here is an example of a first draft organizational system map from an ambulance service.
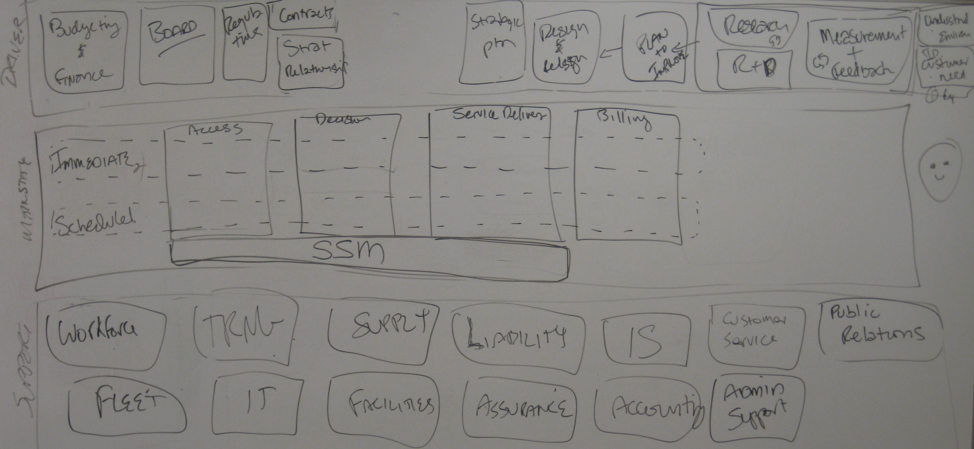
Figure – First Draft of a Linkage of Processes Map
Connect processes that have linkages or interdependence to show relationships. No map is perfect, and it’s expected to evolve as you better understand and improve your system. Next, number each process and consider whether you have a standard approach for each. Do you have a theory for the best way each process should be done? Do you know how reliable it is? These are learning opportunities that will emerge out of understanding your organization as a system.
Here is an example of a more current version of the same ambulance service organization viewed as a system map.
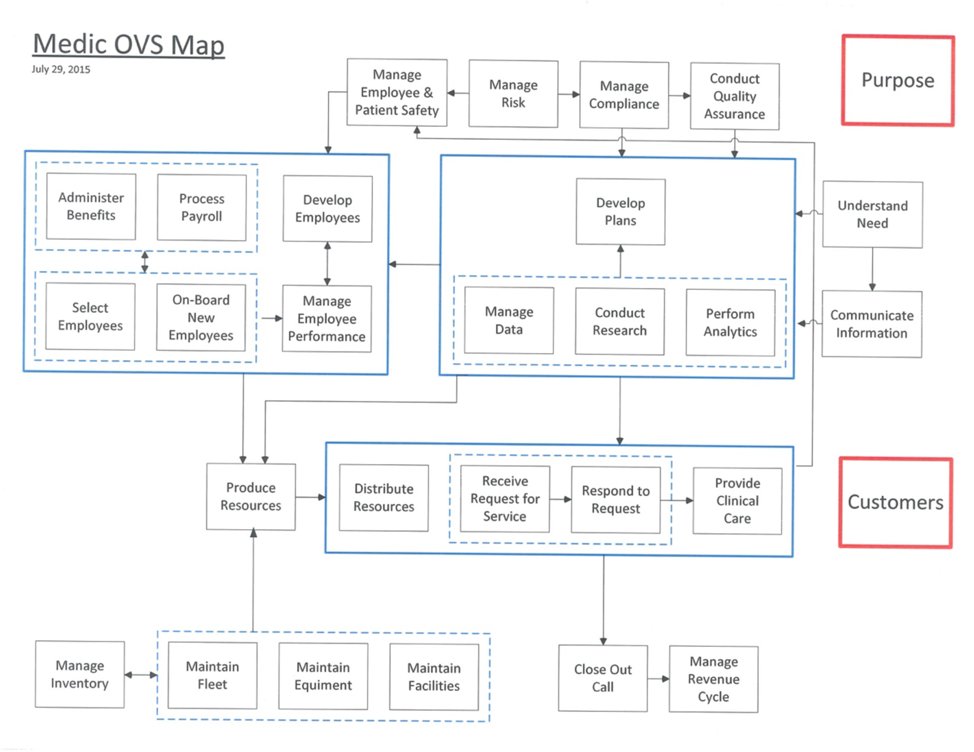
Figure – A More Final Draft of a Systems Map
Closely tied to the organizational system map is the related feedback system of measures. Often referred to as a vector of measures, these measures help us understand key processes and outcomes and are displayed to support understanding the current performance and predicting future performance.
Here is an example of a vector of measures for the same ambulance service.
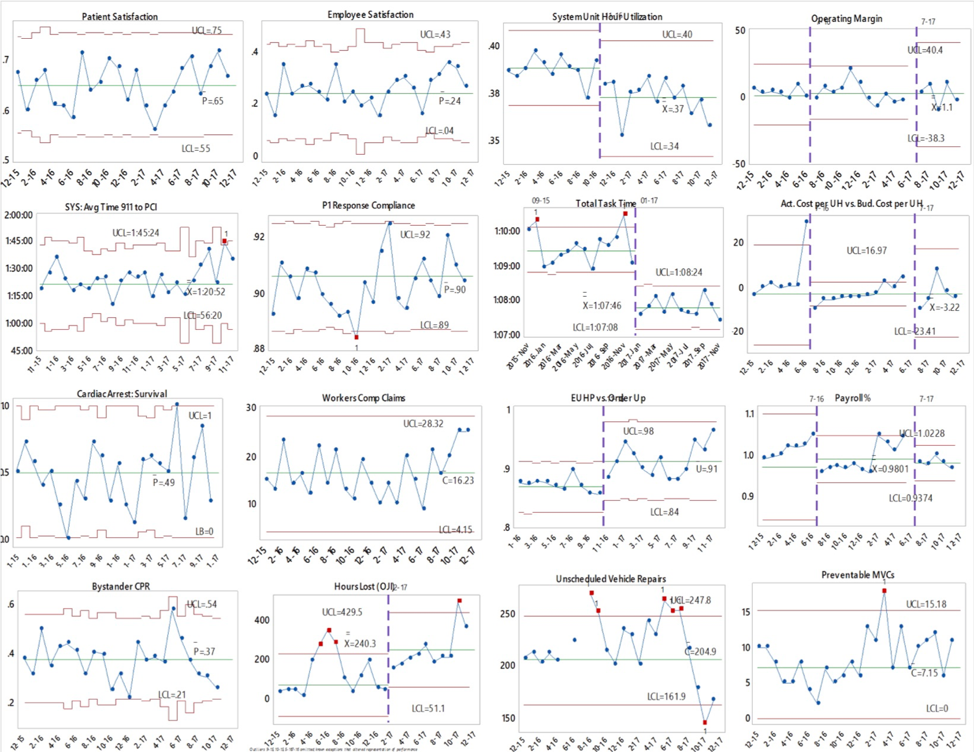
Figure – Vector of Measures
Developing a systems view of your organization and a related vector of measures may be one of the hardest activities for leaders. Many will resist the process initially as too conceptual, but quickly discover how tactical and practical it is as you grapple with the design of your organization and its operations. The process always reveals misalignment, variation, operational definition clarity, absent process, and a host of opportunities for improvement. When done well, leadership teams build will as they learn together. They develop a real appreciation of the opportunity for improvement and a more precise picture of where to act.
In Activity 3, I’ll look at the system for obtaining information in support of planning.
COMING in 2024: Quality as an Organizational Strategy: Building a System of Improvement from Lloyd Provost, Cliff Norman, and Dave WIlliams
—
If this was helpful, share and include me @DaveWilliamsATX. Sign up here to receive a monthly email from me that includes all my blog posts and other Improvement Science resources I think you’d appreciate.